CONTENTS
Overview of ClusterProbe
- Introduction
- Purpose
- What ClusterProbe Software Contains
- Where to Find More Information
- Submitting Comments
Installing the ClusterProbe Software
- Prerequirment for installation
- Where to download ClusterProbe software
- Installing Monitoring Server
- Installing Agent
- Installing Web-based Cluster Management
Tool
- Installing Web Component
- Installing Servlet
Component
Starting ClusterProbe
- Running Monitoring Server
- Starting up agent
- Starting Web-based Cluster Management
Tool
Testing and Debugging ClusterProbe
- Adding or removing node or group
- Adding new resources
- Checking resource configuration
Using Web-based Cluster Management Tool
- Cluster Overview
- Cluster Configuration
- Job Management
- System Configuration Information
- Cluster Monitoring
- Cluster Manipulation
------------------------------
INTRODUCTION
------------------------------
This is version 1.0 of ClusterProbe software. The ClusterProbe software is an open, flexible, scalable and Java-based cluster monitoring tool. This efficient tool can monitor the critical system activities and cluster resource utilization so that cluster administrators can utilize the tool to observe the entire cluster with GUI visualization to manage and maintain the cluster. Also the parallel applications running in cluster can guide their job scheduling according to the resource information retrieved by ClusterProbe.
A Web-based Cluster Management tool is integrated in this package. The management tool interacts with ClusterProbe to obtain kinds of cluster resource information to monitor and manage the cluster resources. All management functions are run from the WWW browser which supports Java and Javascript languages inside. A simple browser is all that's required to begin management.
With an infrastructure steeped in Java technology, ClusterProbe is portable to all platforms with minor modifications even though current version is developed and implemented on Linux platform. This tool can be used to help monitoring both homogeneous and heterogeneous workstations of clusters.
This is the first version of ClusterProbe. Some functions in designation are not completely implemented in this version. We will improve the software in functionality, performance, quality, and bug fix over this version in the latter versions.
The ClusterProbe software is a project of System Research Group, Dept. of Computer
Science and Information Systems, the University of Hong Kong. The research was supported
by the Hong Kong RGC Grants and HKU Equipment Grant.
-----------------------------------------------------------------------
PURPOSE
-----------------------------------------------------------------------
During 1980s, computer scientists believed that the performance of the computer can be improved by creating faster, more efficient processors. But this idea is being challenged by the concept of clustering which, essentially, means linking two or more workstations to perform functions. The goal is to develop infrastructure, both software and hardware, so that clients have no idea on which computer they are actually using. This enables multiple computers to work together as a single system. Rapid promotions in both areas of computing and communication, availability of commodity high performance processors and high-speed networks, facilitate this transition. Using workstation clusters for distributed computing has become popular with the emergence of low-cost, but powerful workstations and high-speed networking facilities.
Monitoring such a platform is a tedious and challenging task since typical workstations are original designed to work as a standalone system, rather than a part of workstation clusters. This can be eased by software systems, which can monitor the entire system as a single system image --- single system monitoring. ClusterProbe is one such system, which implements the single system image at tools/applications level. ClusterProbe software adapts efficient techniques and allows:
- Other subsystems or applications running in the cluster that may need to know the resource configuration or status are able to share the monitoring information collected by ClusterProbe.
- Fast and automatic updates of cluster resource utilities without enormous efforts in modification.
- Scale in capacity to monitor a cluster composed of a large number of computers, without consuming lots of system resources itself.
The Web-based Cluster Management Tool built on top of ClusterProbe allows:
- Monitor system parameters such as CPU load or memory usage of a single node, a group nodes or all nodes of a cluster.
- Schedule or co-schedule parallel jobs on cluster parallel computing environment
- Remote configure system and execute command
- Operate the cluster or view the outputs based on
WWW browser via Internet
-----------------------------------------------------------------------
WHAT CLUSTERPROBE SOFTWARE CONTAINS
-----------------------------------------------------------------------
RUNTIME ----------------------------------------------------------
- Core Classes (clusterprobe.jar)
This file contains all
of the compiled .class files for the platform. It may remain compressed for the compiler
and interpreter to access the class files within it properly or uncompressed for better
performance.
SOURCE FILES -----------------------------------------------------
- Source Files
(src.tar.gz file)
This is the set of
source files used to create the classes included in the core classes clusterprobe.jar file
(above). These source files are provided for development purposes, to help
developers understand and extend the ClusterProbe software.
WEB-BASED CLUSTER MANAGEMENT TOOL ------------
- Web files (WCMT-web.tar.gz)
HTML, Java and
Javascript files accessed by cluster administrators to manage and maintain the system
through Internet.
- Servlet files (WCMT-servlet.tar.gz)
Java Servlet programs
to interact with ClusterProbe to obtain various kinds of cluster information.
-----------------------------------------------------------------------
WHERE TO FIND MORE INFORMATION
-----------------------------------------------------------------------
This README file and source code (src.zip) are the only "documentation" included in this ClusterProbe software bundle. You can browse the white paper for ClusterProbe software by visiting following web site:
http://www.srg.csis.hku.hk/srg/html/papers/ClusterProbe-iwcc99.ps
The paper describes the key techniques and several applications built on top of ClusterProbe:
- Overview of architecture
- Multiprotocol Communication Interface
- Light-Weight Monitoring Agent
- Cascading Hierarchy
- Implementation
- Experiments and demos
This README file of HTML format can be downloaded from:
http://c414b1.csis.hku.hk/ClusterProbe/docs/README.html
And the README file of word format can be downloaded from:
http://c414b1.csis.hku.hk/ClusterProbe/docs/README.doc
-----------------------------------------------------------------------
SUBMITTING COMMENTS AND REPORTING BUGS
-----------------------------------------------------------------------
We are very interested in receiving your comments and suggestions as early as possible.
If you have comments and information suggestion, specific feature request or bug to report, please send them directly to us , the email address are listed as follows:
zyliang@csis.hku.hk
Bugs
clwang@csis.hku.hk
Feature requests or comments
While we are not able to respond individually to each comment, we do review all
comments.
-----------------------------------------------------------------------
PREREQUIRMENT FOR INSTALLATION
-----------------------------------------------------------------------
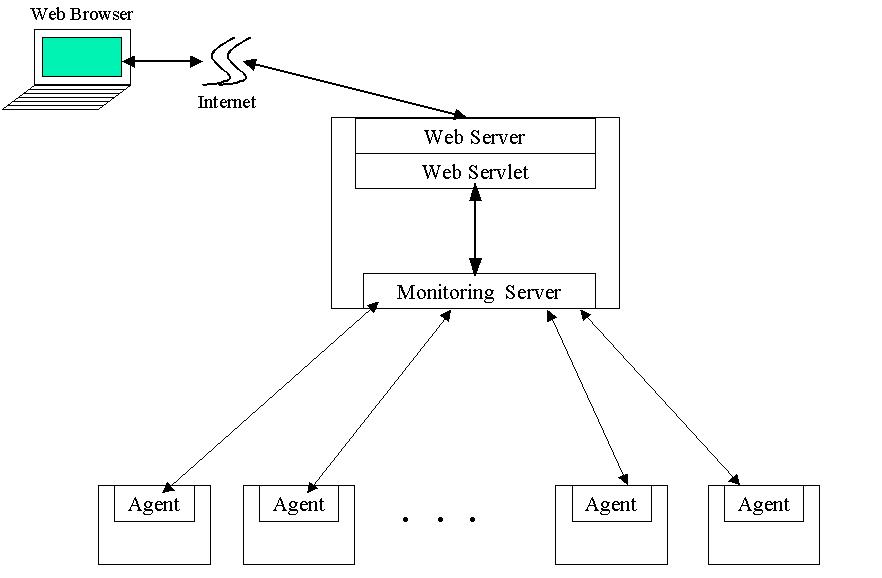
ClusterProbe consists of two main components: monitoring server and agent (figure 1). The monitoring server, which resides on one powerful node of cluster, is responsible for handling the requests from clients and forwarding the monitoring results to the clients that are of interest. The agent executes as a daemon on all the nodes that comprise the cluster, collects and reports local resource activities and utilization. Here are the prerequirements for installing the agent:
- JDK or JRE software installed, version above 1.1.6.
- 1M hard disk capacity available.
- 16M or more memory.
- Own super user authority.
Due to the security reasons, the Web-based Cluster Management Tool must be installed to the same computer as the monitoring server. Following are the requirements for installing the monitoring server and web-based Cluster Management Tool.
- JDK or JRE software installed, version above
1.1.6.
- JSDK software installed, version above 1.0.2.
- Web server installed.
- 2M hard disk capacity available.
- 16M or more memory.
Figure 1. Components of ClusterProbe Software
( This figure has been reduced to fit on the page. Click the image to view it as its
natural size. )
-----------------------------------------------------------------------
WHERE TO DOWNLOAD CLUSTERPROBE
-----------------------------------------------------------------------
ClusterProbe will be available for download soon.
-----------------------------------------------------------------------
INSTALLING MONITORING SERVER
-----------------------------------------------------------------------
Here are the abbreviated instructions. These instructions are quite general since the installation procedure may be changed in further versions.
1. Download "clusterprobe.jar" and "runs" files from the sites specified in last screen. Place them to directory /usr/local/ClusterProbe, if there is no that directory, create a new one.
2. Modify the configuration defined in "runs" file:
- set PATH, export the binary
directories of JDK(JRE) and JSDK to PATH Environment Variable.
- set CLASSPATH, export JDK(JRE) class
path ( if JDK version is 1.x) and JSDK class path to CLASSPATH Environment Variable.
3. Type "chmod a+x
/usr/local/ClusterProbe/runs" to allow all users to execute the file.
-----------------------------------------------------------------------
INSTALLING AGENT
-----------------------------------------------------------------------
There are two methods to install agent on cluster nodes. One method starts the agent locally which installs all classes needed by agent before running, another method bootstraps the agent which only install a "ClassLoader" class and the other classes will be downloading from server on runtime (the latter method is only available for JDK 1.2.x version). The two methods have difference installation procedures:
- For starting Agent locally, you should:
1. Downloading "Agent.tar.gz" file, use " tar zxvf Agent.tar.gz" to uncompress it under directory /usr/local/ClusterProbe, if there is no this directory, make it before your uncompressing. After uncompressing, two files are created, "clusterprobe.jar" containing all classes for Agent and "runa" for starting the Agent.
2. Modify the PATH and CLASSPATH Environment Variables in "runa".
- For bootstrapping Agent, you should:
1. Downloading "Agent_bs.tar.gz" file, use "tar zxvf Agent_bs.tar.gz" to uncompress the file under directory /usr/local/ClusterProbe, if there is no this directory, make it first. After uncompressing, there are two classes file and a script file "runa".
2. Downloading the java archive file "clusterprobe.jar" and placing it on a web server which the agent node can reach the archive via HTTP protocol. Basically, you can use the monitoring server to be web server since installing Web-based Cluster Management Tool also need a web server.
3. Modify the PATH Environment
Variable in "runa".
----------------------------------------------------------------------------------
INSTALLING WEB-BASED CLUSTER MANAGEMENT TOOL
----------------------------------------------------------------------------------
As we mentioned above, due to the security reasons, the applet running in client
browser only can communicate with server which dispatched the applet. The Web-based
Cluster Management Tool must be installed to the same machine as the monitor server.
Before using the tool, you must install the two major components --- web component and
servlet component one by one.
----------------------------------------------------------------------------------
INSTALLING WEB COMPONENT
----------------------------------------------------------------------------------
The purpose of web component is to communicate with client browser. This component includes some HTML files, JavaScript files, Java class archive, and some other configuration files.
Before installing the component, you must have a web server available and create a directory under the web server document directory to install the component ( or you can directly place the component under the document directory instead creating a directory).
Downloading "WCMT-web.tar.gz", using command "tar zxvf
WCMT-web.tar.gz" to uncompress it under the web directory selected to place those
files. Copy the "marker.txt","clusterprobe.jar" and
"back1.jpg" files to web document directory.
----------------------------------------------------------------------------------
INSTALLING SERVLET COMPONENT
----------------------------------------------------------------------------------
The servlet component of Web-based Cluster Management Tool is responsible to interact with ClusterProbe monitoring server. This component is implemented based on Java Servlet software and includes some Java classes and script files.
Download "WCMT-servlet.tar.gz", change current directory to JSDK directory
(for example, change to /usr/local/JSDK2.0), then uncompress the file. After
installation, remember to uncomment and modify the scripts related to WCMT in
"/usr/local/ClusterProbe/runs".
----------------------------------------------------------------------------------
RUNNING MONITORING SERVER
----------------------------------------------------------------------------------
Before starting monitoring server, you must setup two configuration files --- "node_resolv" and "queue.conf". The former file defines the information of the nodes comprised the cluster. The latter file defines the information of the groups (domains) containing a set of nodes based on resource type or job allocation policy, for example the SMP group or Batch Job group. This two files should be placed under directory "/etc" and open the read permission for all users.
Following is a portion of the "node_resolv" file in our cluster environment:
# Host Name Alias
Name
Group Name
Description
Type ID Location
c414b1
c414b1.csis.hku.hk
cluster0
"ClusterProbe
Server"
0
0->13
c414b2
c414b2.csis.hku.hk
cluster0
PII
0
0->14
fast1
fast1.csis.hku.hk
fast
CeleronA/300x2
0
0->1;1->1
fast2
fast2.csis.hku.hk
fast
CeleronA/300x2
0
0->2;1->2
switch1
202.45.128.201
fast
"DP
switch"
2
1
hub1
null
cluster0
"Campus
Hub"
1
0
Host Name: the system's host name.
Alias Name: the alias name(s) for the system
Group Name: If the node belongs to any group(domain), set the group name here.
Description: brief description for the node.
Type ID: the ID to identify the node type. 0 for PCs or workstations, 1 for Hubs, 2 for switches ....
Location: describe the location of each node. For example, "0->13"
means the node connects to the switch(hub) 0 via port 13.
Here also presents a example of the "queue.conf" file:
# Group Name
Description
Master Node
cluster0
Batch
c414b1
fast
DQS_Fast_Cluster
fast1
Group Name: the name of the group. The name must be identical to the name set in the resolv.conf file.
Description: brief description for the function of the group. For the group installed DQS or CODINE software( a job management tool, we will discuss it in latter sections), the description must start with "DQS".
Master Node: the master node is the node running the DQS/CODINE master module or
ClusterProbe proxy module ( not implemented in current version).
After setup the configuration files, you can start monitoring server by typing
/usr/local/ClusterProbe/runs
under unix shell window. You also can add this script to "/etc/rc.d/rc.local"
file, to start up monitoring server when system is up.
----------------------------------------------------------------------------------
STARTING UP AGENT
----------------------------------------------------------------------------------
It is not necessary to start an agent before or after the monitoring server is up. You can start an agent at any time and the agent will automatically register to monitoring server without human intervention.
As we mentioned above, agent has two running modes --- local mode and bootstrapping mode. For local mode, you can easily start the agent by typing
/usr/local/ClusterProbe/runa
under unix shell window.
For bootstrapping mode, you must know where is the "clusterprobe.jar" archive and use its URL address as an argument. Suppose the URL address is "http://web_server/dir/clusterprobe.jar", you can bootstrap the agent by typing:
/usr/local/ClusterProbe/runa http://web_server/dir/clusterprobe.jar
You also can add above scripts into the "/etc/rc.d/rc.local" file to
automatically start agent while machine is up.
----------------------------------------------------------------------------------
STARTING WEB-BASE CLUSTER MANAGEMENT TOOL
----------------------------------------------------------------------------------
Normally, you also start up the Web-based Cluster Management Tool while you start up
the monitoring server if you uncomment the scripts for the management tool in
"runs" file. In this case, there is no extra operations for starting the tool.
Remember you maybe need to modify the "runs" file to ensure that the JSDK
directory is correctly set.
After starting up ClusterProbe, how do you know the tool is functional? How to check the configuration and status of ClusterProbe? How to debug its configuration and extend its functions dynamically? Several programs in ClusterProbe classes package are written for those purposes.
Please set up the following environment variables before you use these testing programs:
( csh ):
setenv JDK_HOME /usr/local/jdk????
setenv CLASSPATH /usr/local/ClusterProbe/clusterprobe.jar:./
set path ( $path ${JDK_HOME)/bin )
( ksh ):
JDK_HOME=/usr/local/jdk????
export JDK_HOME
CLASSPATH=./:/usr/local/ClusterProbe/clusterprobe.jar
export CLASSPATH
PATH=$PATH:$JDK_HOME/bin
export PATH
----------------------------------------------------------------------------------
ADDING AND REMOVING NODE OR GROUP
----------------------------------------------------------------------------------
-- Show node and group configuration
you can type following program:
java CLUSTERPROBE.demo.GetCurrentValueDemo CLUSTERPROBE.resources.Cluster_NodeLists hostname-of-monitoring-server port(7001)
When you type the program, ClusterProbe monitoring server would read the information of cluster nodes from "/etc/node_resolv" file, pack it and send to the program. Finally, the information of current node configuration will be shown on the screen. Figure 2 is an sample output of this program:
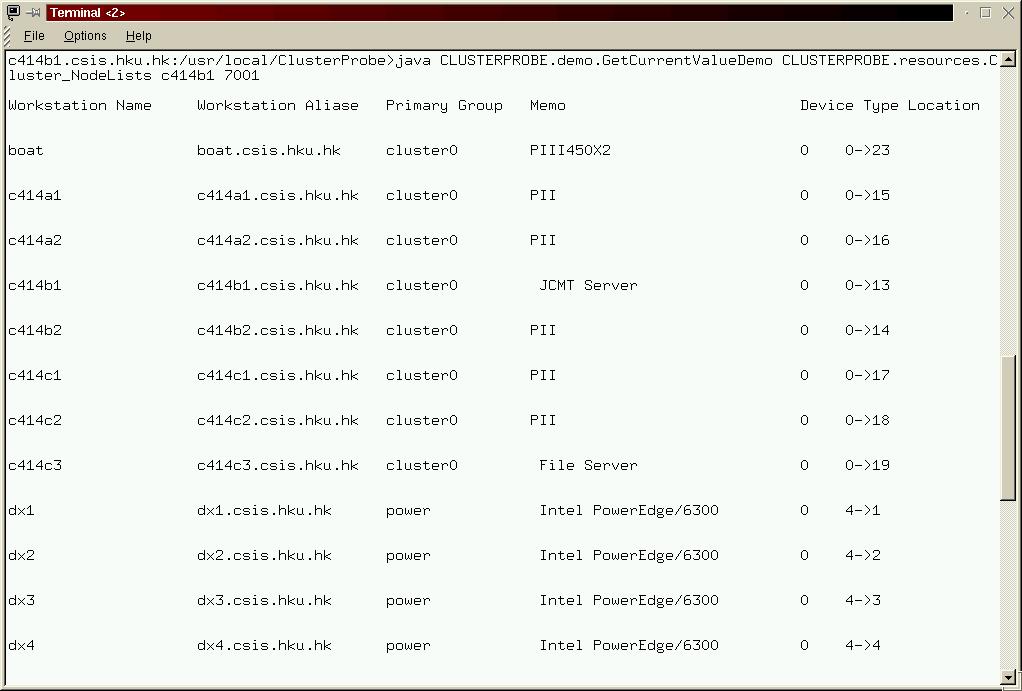
Figure 2. Check node configuration
( This figure has been reduced to fit on the page. Click the image to view it as its
natural size. )
To show group configuration, you can type:
java CLUSTERPROBE.demo.GetCurrentValueDemo CLUSTERPROBE.resources.Cluster_GroupLists hostname-of-monitoring-server 7001
The information of group configuration would be retrieved from
"/etc/queue.conf" file and be shown on the screen as a table.
-- Modifying the configuration of node or group
At first, you modify the "/etc/node_resolv" or "/etc/queue.conf" file as your needs. Then type following script:
java CLUSTERPROBE.demo.UpdateNotify
CLUSTERPROBE.resources.Cluster_NodeLists hostname-of-monitoring-server 7001
or
java CLUSTERPROBE.demo.UpdateNotify
CLUSTERPROBE.resources.Cluster_GroupLists hostname-of-monitoring-server 7001
to inform monitoring server to reread those two configuration files. After execution,
you can use the two commands in last section to check if the configuration is correctly
changed.
----------------------------------------------------------------------------------
ADDING NEW RESOURCES
----------------------------------------------------------------------------------
To monitoring a new resource, you must write and compile a new Java class to describe the behaviors that how to retrieve status information and control the new resource. Because we have implemented most common resource behaviors in class "ResourceTable", the new resource class, which extends "ResourceTable" class, only need to implement the several abstract methods defined in "ResourceTable" class. Following are these abstract methods that must be implemented by the new resource:
package CLUSTERPROBE.resources;
public class ResourceTable extends Resource implements
Serializable
{
// getTableType( ), define the type of the value format
of resources. If the status of this resource on each node can be described by a single
record, then a single table is enough to show the information of the resources of all
nodes, such as "memory", "OS version", and "timing". For
other resources, a table is used to present the information of the resource of each node,
then multiple tables are used to present total resource information, such as "Route
Table", "CPU Usage", and "Hard disk".
public abstract int getTableType( );
// getEntryNames( ), define entry names for resources.
For example, the entry names of resource "memory" are "Host Name",
"Total Memory", "Used Memory", "Free Memory", "Shared
Memory", "Buffers", and "Cache".
public abstract String[ ] getEntryNames( );
// getEntryType( ), define data types of the resource entries.
For instance, the entry types of resource "memory" are "STRING",
"LONG", "LONG", "LONG", "LONG", "LONG",
and "LONG".
public abstract int[ ] getEntryType( );
// getKeyName( ), define the key entry by specifying the entry
name. In the example for "memory" resource, the key entry name is "Host
Name".
public abstract String getKeyName( );
// getRange( ), this method is used to specify which records
are viewable and operatable.
public abstract Vector getRange(String entryName);
// getDesc( ), define the description for resources.
public abstract String getDesc( );
// getVector( ), If the table type of a resource is
"Single" table, you must rewrite the method to define the operation for
retrieving resource data. The return value is a record packed with "Vector"
format.
public Vector getVector( ) throws
java.rmi.ServerRuntimeException;
// getHashTable( ), If the table type of a resource is
"Multiple" tables, you must implement the operation for retrieving resource data
in this method. The return value is a table packed with "Hashtable" format.
public Hashtable getHashTable( ) throws
java.rmi.ServerRuntimeException;
// getVectorExceptionProcess( ), define the processing method when
the operation to access resource is fail. This method is optional. Default process for
exception is to return "null" value.
public Vector getVectorExceptionProcess(String host, Exception e);
// getHashtableExceptionProcess( ), it is the exception processing
method for "multiple" table resources.
public Hashtable getHashtableExceptionProcess(String host, Exception
e);
}
The new resource program must be compiled and installed before you can use it. To compile a resource program, you can use following commands:
cd /tmp
jar xvf /usr/local/ClusterProbe/clusterprobe.jar
java new-resource-programs
jar cvf /usr/local/ClusterProbe/clusterprobe.jar CLUSTERPROBE graph
rm -rf CLUSTERPROBE graph
After you got the updated "clusterprobe.jar" archive, you should also update
the archive installed on agent ( local mode) and the web server (bootstrapping mode) with
the new version.
----------------------------------------------------------------------------------
CHECKING RESOURCE CONFIGURATION
----------------------------------------------------------------------------------
The tool "GetCurrentValueDemo" can be used to check resource configuration . Actually, checking node or group configuration we discuss in above section is an example to use this tool. You can check resource configuration by:
java CLUSTERPROBE.demo.GetCurrentValueDemo resource-class-name host-name-of-monitoring-server port-of-monitoring-server(7001)
configuration value will be shown on standard output.
To start Web-based Cluster Management Tool, simply type the host name or IP address of the monitoring server in the address field and press Enter on your browser (preferred the Netscape 4.0 or above version, some java scripts are not supported in IE). This brings up the cluster management page, as shown in the following figure.

Figure 3: Start Page of Web-based Cluster Management Tool
In this page, the top frame is the logo area, designing for headings and title images.
The left-bottom frame called menu area places menu options and the right-bottom frame
called data area shows the results.
----------------------------------------------------------------------------------
CLUSTER OVERVIEW
----------------------------------------------------------------------------------
This selection branches in to the three sub-menus used for cluster overview:
Cluster Snapshot A photograph of the cluster.
Cluster Map Show the physical map of the cluster
Cluster Status Dynamically
show real-time status of the cluster.
Cluster Snapshot
The Cluster Snapshot Panel, shown in Figure 3, is the first panel you see when entering
in through the Web. This panel shows you a photograph of the cluster. You can show your
own picture by replacing the image file "snapshot.jpg" under the web server
document directory.
Cluster Map
Selecting this option displays the Cluster Physical Map Panel, shown in Figure 4. This panel shows your the physical map of cluster. You can show your own map by replacing the image file "layer_0_550x600_group.jpg" under the web server document directory.
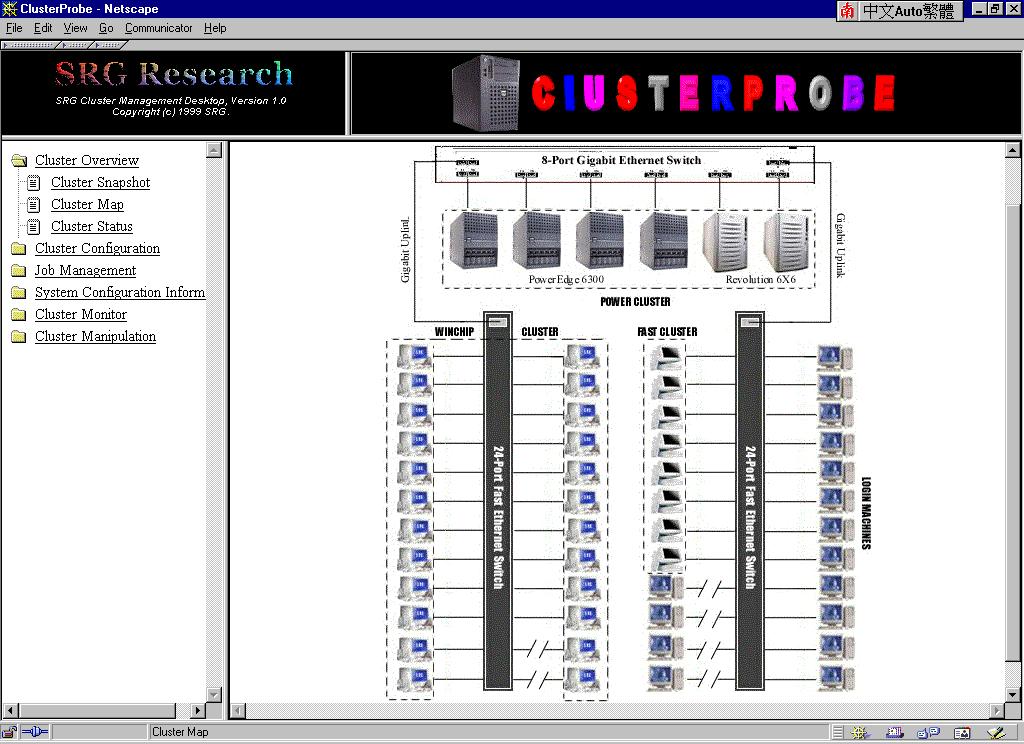
Figure 4: Cluster Physical Map Panel
( This figure has been reduced to fit on the page. Click the image to view it as its
natural size. )
Cluster Status
Selecting this option pops up the Cluster Real-time Status Panel, shown in Figure 5. This panel shows you the real-time status of cluster by retrieving cluster status from ClusterProbe and generating the status picture dynamically. As default, the picture is regenerated within 10 seconds.
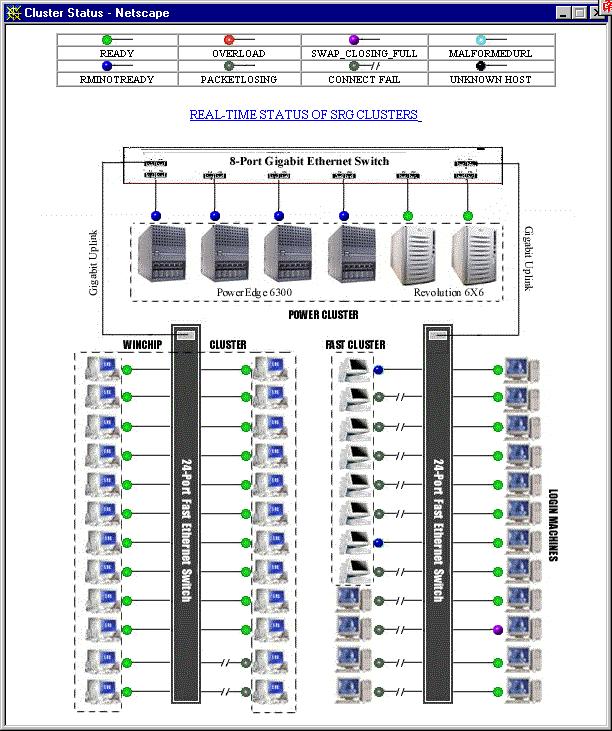
Figure 5: Cluster Real-time Status Panel
( This figure has been reduced to fit on the page. Click the image to view it as its
natural size. )
Cluster Realtime Status Panel can present following status:
![]() , Ready. The node is reachable
and available.
, Ready. The node is reachable
and available.
![]() , Overload. The node is running
load-intensive job(s) and is not appropriate for submitting new job(s).
, Overload. The node is running
load-intensive job(s) and is not appropriate for submitting new job(s).
![]() , Swap-Closing-Full. The swap
memory is near worn up.
, Swap-Closing-Full. The swap
memory is near worn up.
![]() , Malformated URL. The
access URL is malformatted or unauthoritative.
, Malformated URL. The
access URL is malformatted or unauthoritative.
![]() , RMI-Not-Ready. The node
is reachable but unmanagable. ClusterProbe agent is not running on this node.
, RMI-Not-Ready. The node
is reachable but unmanagable. ClusterProbe agent is not running on this node.
![]() , Package-Losing. Some
in/out packages is not correctly receiving/sending in current time.
, Package-Losing. Some
in/out packages is not correctly receiving/sending in current time.
![]() , Connect-Fail. The node is
unreachable.
, Connect-Fail. The node is
unreachable.
![]() , Host-Unknown. The host name
can not be resolved through DNS servers.
, Host-Unknown. The host name
can not be resolved through DNS servers.
----------------------------------------------------------------------------------
CLUSTER CONFIGURATION
----------------------------------------------------------------------------------
This selection branches in to the two sub-menus used for cluster configuration:
Cluster Node Show node configuration of the cluster.
Cluster Group Show group
configuration of the cluster.
Cluster Node
Selection this option displays the Cluster Node Configuration Panel, shown in Figure 6. The node configuration is read only in this version. In further version, the configuration will be able to set online.

Figure 6: Cluster Node Configuration Panel
( This figure has been reduced to fit on the page. Click the image to view it as its
natural size. )
Cluster Group
Selection this option displays the Cluster Group Configuration Panel, shown in Figure 7. This panel shows you the group information of the cluster. Groups are the subsets of cluster nodes based on hardware / software types or job allocation policies.
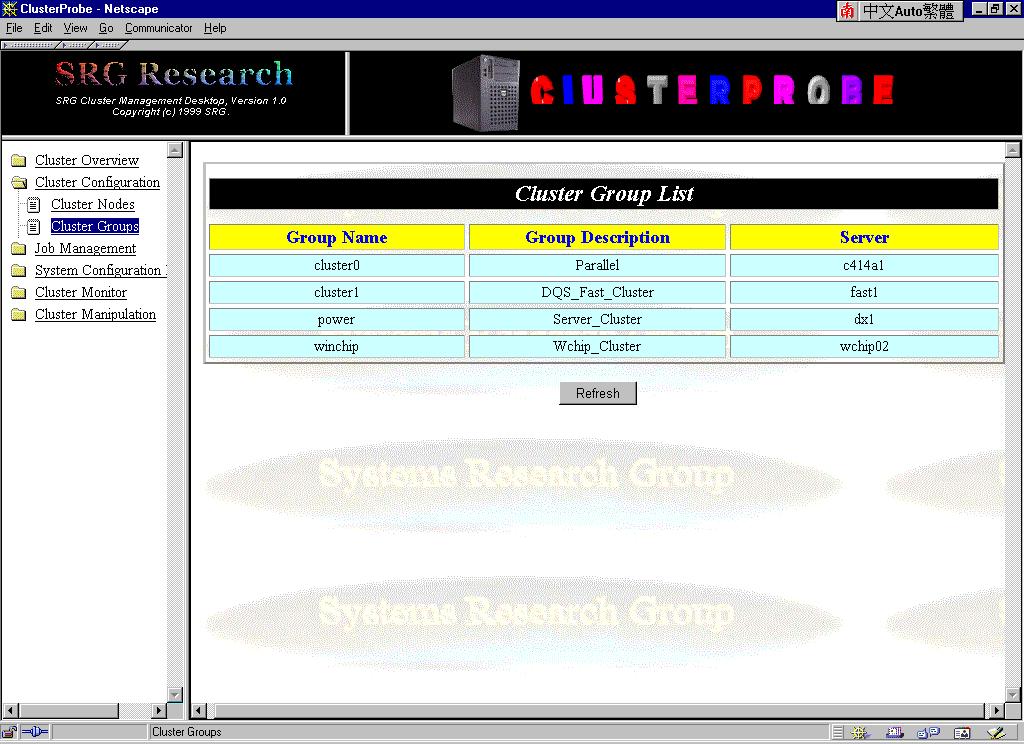
Figure 7: Cluster Group Configuration Panel
( This figure has been reduced to fit on the page. Click the image to view it as its
natural size. )
----------------------------------------------------------------------------------
JOB MANAGEMENT
----------------------------------------------------------------------------------
This selection branches in to the three sub-menus used for job management:
Queue Statistics Query queue(node) configuration and status.
Job Statistics Check the running and pending jobs.
ClusterProbe Scheduler Link to ClusterProbe Scheduler login
page.
Queue Statistics
Selecting this option displays the Queue Statistics Panel, shown as Figure 8. In ClusterProbe, the job management component is built on top of DQS(Distributed Queue System) or CODINE cluster management subsystem. So you should install and start the DQS or CODINE before using ClusterProbe Job Management functions. The DQS software package and document can be downloaded from our ftp site:
ftp://c414c3.csis.hku.hk/pub/DQS/
or you can directly access DQS home page for the newest features by:
http://www.scri.fsu.edu/~pasko/dqs.html
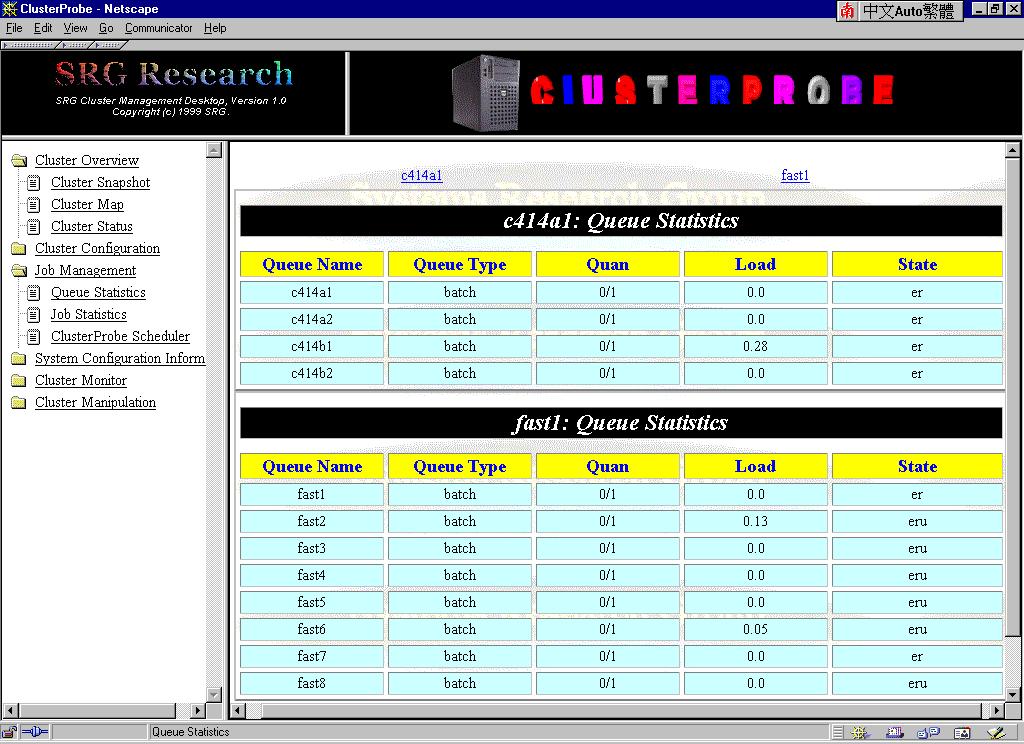
Figure 8: Queue Statistics Panel
( This figure has been reduced to fit on the page. Click the image to view it as its
natural size. )
If there are more than one DQS subsystems installed in the cluster, each subsystem has its corresponding statistics table to be shown in this panel. The master names printed on the top of the panel are used to locate corresponding table.
Queue Name Displays the name of queue(node).
Queue Type Displays what type of jobs will be processed by the queue.
Quan. Displays the job quantities in the queue. (Quan. of running jobs / Quan. of Maximum jobs)
Load Displays the load information of the queue.
State
Displays the state of the queue.
Job Statistics
Selection this option displays Job Statistics Panel, as shown in Figure 9. This panel shows the running or pending job information. "Running Job" refers to the job being processed by cluster and "Pending Job" refers to the job in the waiting lists.

Figure 9: Job Statistics Panel
( This figure has been reduced to fit on the page. Click the image to view it as its
natural size. )
User Name Displays the name of user who submitted the job.
Job Name Displays the job name defined by the user.
Job Number Displays the node numbers requested by the job.
Job Priority Displays the priority level of the job.
Stat Displays the job status (Running or Pending).
Exec_Hosts Displays the names of the hosts assigned to the job.
Submit Time
Displays the time when user submitted the job.
ClusterProbe Scheduler
Selection this option pops up the ClusterProbe Scheduler Login Page, as shown Figure 10. ClusterProbe Scheduler is an extended function component of Web-based Cluster Management Tool. The use of ClusterProbe Scheduler for the purpose of submitting parallel jobs are very simple because the scheduler offers a WWW interactive interface. Users can use the scheduler to login, compile , submit, and check their jobs anywhere as long as they have a WWW enabled browser. You can login in ClusterProbe Scheduler and see the introduction page for details.
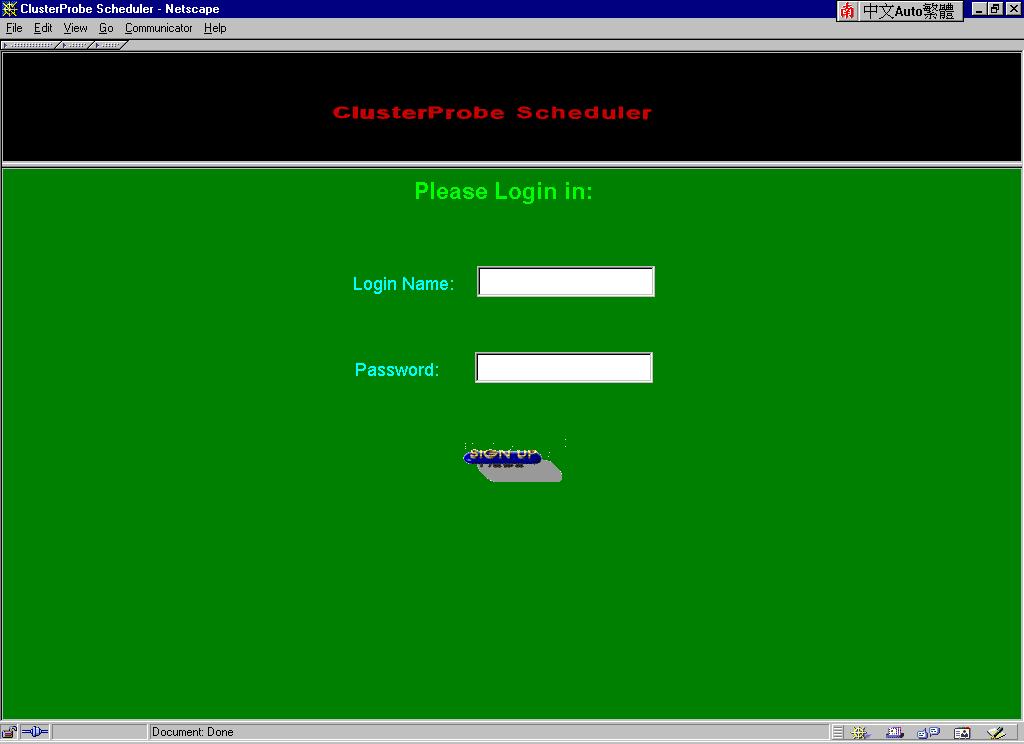
Figure 10: ClusterProbe Scheduler Login Page
( This figure has been reduced to fit on the page. Click the image to view it as its
natural size. )
----------------------------------------------------------------------------------
SYSTEM CONFIGURATION INFORMATION
----------------------------------------------------------------------------------
This selection branches in to the fifteen sub-menus used for checking resource status:
CPU Displays CPU configuration information, such as CPU mode, frequency, manufacturer and so on.
Memory Displays memory utilities, such as the size of capacity, used memory, free memory and so on.
Filesystem utility Displays file system utilities, such as file system name, mount point, size, usage, and so on.
Device Displays installed device information, such as device name, type, major No., and so on.
File System Displays file system configuration, such as fs_spec, fs_type, fs_file and so on.
Exported Filesystem Displays exported file system information, such as exported fs, options and so on.
I/O Ports Displays I/O port configuration, such as I/O address, device and so on.
Load Modules Displays loaded module information, such as module name, page No., users and so on.
Kernel Symbols Displays kernel symbol information, such as symbol address, name, definer and so on.
ARP Table Displays ARP(Address Resolution Protocol) table.
Network Interface Displays network interface configuration, such as NI name, address, netmask, and so on.
Route Table Displays route table.
OS Version Displays platform versions, including OS name, version, release and so on.
User Information Displays valid user information, including user name, ID, group ID, description and so on.
Status
Table
Displays cluster status, including node name, IP address, state and so on.
Selecting one of above options displays the configuration or status of relevant cluster resource. For instance, Figure 11 shows the CPU Information Panel by selecting the "CPU" submenu. You can add new resource options under this menu, just link to the URL address as followed:
http://the-url-path-of-servlet/cics_show?rname=your-resource-name
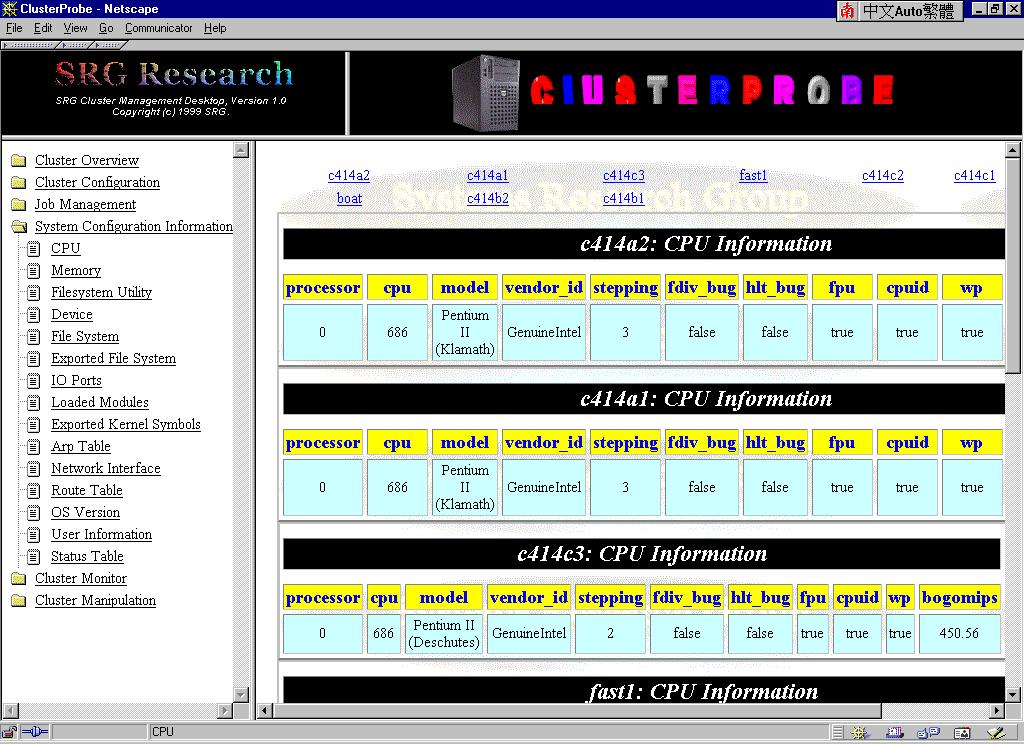
Figure 11: CPU Information Panel
( This figure has been reduced to fit on the page. Click the image to view it as its
natural size. )
----------------------------------------------------------------------------------
CLUSTER MONITOR
----------------------------------------------------------------------------------
This selection branches in to two types of submenus used for monitoring resource status:
Monitor Wizard Guide users to construct their monitoring tasks.
Predefined Tasks Some general
monitoring tasks predefined by administrators.
Monitor Wizard
Selecting this option displays a serial of Monitoring Wizard Panels, instructing users to build their monitoring tasks step by step. With the wizard, user can easily set the monitoring request without knowing the details how to write monitoring URLs.
The following commands are used throughout the Monitoring Wizard Panels.
Next Implements and saves the options you have just made in this step. Then enters next wizard step.
Back Returns and displays the options you made last time in previous wizard step.
Finished Select the Finished button that appears next to the Back button in the last wizard panel after you have made all options.
Follow these steps to set monitoring task by monitor wizard:
Step 1. Select the resource to be monitored, as shown in figure 12.
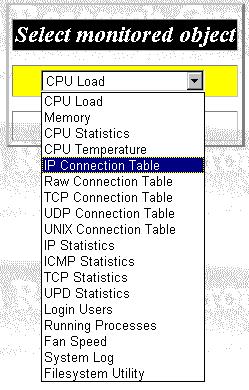
Figure 12: Monitoring Wizard Panel 1
Step 2. Select the resource entries to be monitored, as shown in figure 13.
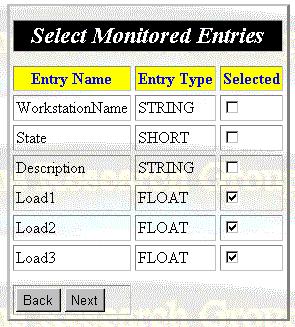
Figure 13: Monitoring Wizard Panel 2
Step 3. Choose the type to selecting monitored hosts, you can select by node or by group, as shown in figure 14.
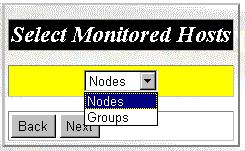
Figure 14: Monitoring Wizard Panel 3
Step 4-1. Select involved hosts by choosing nodes, as shown in figure 15.

Figure 15: Monitoring Wizard Panel 4-1
Step 4-2. Select involved hosts by choosing groups, as shown in figure 16.
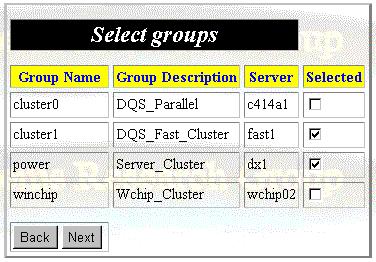
Figure 16: Monitoring Wizard Panel 4-2
Step 5. Select the time intervals for checking and reporting resource status, as shown figure 17.
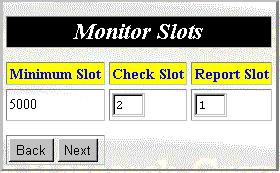
Figure 17: Monitoring Wizard Panel 5
Step 6. The last step, select the display format for the coming resource status, as shown figure 18.
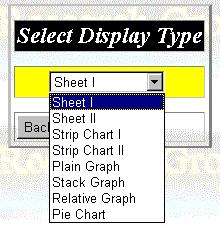
Figure 18: Monitoring Wizard Panel 6.
In this version, we support following 8 display formats for resource status data:
Sheet I Uses sheets to display resource status data, each sheet presents all resource data of a specific host.
Sheet II Also uses sheets to display resource status data, but each sheet presents a specific resource entry of all involved hosts.
Strip Chart I Similar to Sheet I, but uses strip chart to display the current and history resource data.
Strip Chart II Similar to Sheet II, but uses strip chart to display the current and history resource data.
Plain Graph Uses clustered column chart to show resource data.
Stack Graph Similar to Plain Graph, except for using stack column chart.
Relative Graph Similar to Plain Graph, except for using relative column chart.
Pie Chart
Uses pie chart to present resource data, such as memory, disk usage.
Following are two examples using the wizard. In first example, we select "Memory" in step 1 --> check "MemUsed", "MemFree", "MemShared", "Buffers", and "Cached" in step 2 --> Select "Groups" in step 3 --> Check "cluster1" in step 4 --> Use the default value in step 5 --> Select "Pie Chart" in final step --> Submit the monitoring task by clicking "Finished" button. A monitoring panel pops up and displays memory statistics using pie chart, as shown in figure 19.
Figure 19: Memory Statistics Pie Chart
( This figure has been reduced to fit on the page. Click the image to view it as its
natural size. )
In example 2, we select "CPU Load" in step 1 --> check "Load1", "Load2", and "Load3" in step 2 --> Select "Nodes" in step 3 --> Check "c414a1", "c414a2", "c414b1", "c414b2", "c414c1", "c414c2", "c414c3", "srgd2", and "srgd3" in step 4 --> Use the default value in step 5 --> Select "Strip Chart I" in final step --> Submit the monitoring task by clicking "Finished" button. A monitoring panel pops up and displays work load status using strip chart, as shown in figure 20.

Figure 20: Work Load Strip Chart
( This figure has been reduced to fit on the page. Click the image to view it as its
natural size. )
Predefined Tasks
To be convenient, you can predefine the tasks, instead of using wizard to set it each time before using it. The format to define monitoring task is:
http://the-url-path-of-servlet/cics_monitor?step=7&rname=resourceID&entries=entryID|entryID...
&hopt=0or1&hosts=hostsname|hostname|...&slots=checkslot|reportslot&dtype=typeID
Following two urls are the predefined tasks for the examples in previous section:
http://the-url-path-of-servlet/cics_monitor?step=7&rname=1&entries=2|3|4|5&hopt=1&hosts=cluster1&slots=2|1&dtype=7
And
http://the-url-path-of-servlet/cics_monitor?step=7&rname=0&entries=3|4|5&hopt=0&hosts=
c414a1|c414b1|c414a2|c414b2|c414c1|c414c2|c414c3|srgd2|srgd3&slots=2|1&dtype=2
----------------------------------------------------------------------------------
CLUSTER MANIPULATION
----------------------------------------------------------------------------------
This selection branches in to three submenus used for manipulating cluster:
Login Identify who are using this function.
Preset Operations Some general operations predefined by administrators.
Define Operation
define and submit operations on the fly.
Login
Before users manipulate cluster through Web-based Cluster Management Tool, they must login first. The purpose of Login procedure is to testify the identification of users who will make operations on the cluster and give relevant permissions corresponding to user's authority. (Note: To make Login functional, you should install the "chkpwd" program under directory "/usr/sbin" on ClusterProbe Monitoring Server. The "chkpwd" program can be downloaded from our downloading sites. )
Typing in your user name and password if they are configured for you by the
administrators. If not, contact the administrator to configure them and set the cluster
access authority to you.
Preset Operations
To be convenient, administrators preset some general operations instead of setting the commands and parameters each time before operating. The preset operations are defined in the file "/etc/presets" on monitoring server, monitoring server will import the predefined operation information when starting up.
The format ot define an operation in "presets" file is as followed:
Section
"operation-name"
// The name for the operation
Tolerant
"true_or_false"
// If select true, the operation will ignore the errors while executing. Default value is
"false".
Wait
"true_or_false"
// If select true, the scripts will blocked execute by order. Default value is
"true".
Subsection
"Targets"
// Specify the hosts involved in the operation here
"hostA"; "hostB"; .....;
"name_for_this_serial_hosts" //the hosts involving in the firstly
executing script
"hostC"; "hostD"; ....;
"name_for_this_serial_hosts" //the hosts involving in the secondly
executing script
................
EndSubsection
Subsection
"Scripts"
// Specify the operation scripts here
"Command-Absolution-Path/Command-Name Arguments" //the
script to be executed firstly
"Command-Absolution-Path/Command-Name Arguments" //the
script to be executed secondly
.............
EndSubsection
Subsection
"Arguments"
// Specify the command arguments here
"$1"; "the-name-of-the-argument";
"default-value"
"$2"; "the-name-of-the-argument";
"default-value"
...............
EndSubsection
EndSection
Following is the portion of the "presets" file defined the "Reboot" and "Shutdown" operations in our cluster:
#Preset the scripts run on the cluster
Section "Reboot"
Tolerant "true"
Wait "false"
Confirm "Are you sure to reboot the cluster?"
Subsection "Targets"
"fast1"; "First nodes to be
reboot"
"fast2" "fast3"
"fast3" "fast4" "fast5" "fast6" "fast7"
"fast8"; "Secondary nodes to be reboot"
EndSubsection
Subsection "Scripts"
"/sbin/shutdown -r -t $1 $2 $3"
"/sbin/shutdown -r -t $1 $2 $3"
"/sbin/shutdown -r -t $1 $2 $3"
EndSubsection
Subsection "Arguments"
"$1"; "the second
delay"; "0"
"$2"; "when
reboot the machine"; "now"
"$3"; "The
warning message"; " "
EndSubsection
EndSection
Section "Shutdown"
Tolerant "true"
Wait "false"
Confirm "Are you sure to reboot the cluster?"
Subsection "Targets"
"fast1"; "First nodes to be
reboot"
"fast2" "fast3"
"fast4" "fast5" "fast6" "fast7"
"fast8"; "Secondary nodes to be reboot"
EndSubsection
Subsection "Scripts"
"/sbin/shutdown -t $1 $2 $3"
"/sbin/shutdown -t $1 $2 $3"
"/sbin/shutdown -t $1 $2 $3"
EndSubsection
Subsection "Arguments"
"$1"; "The
delay"; "0"
"$2"; "when
reboot the machine"; "now"
"$3"; "The
warning message"; " "
EndSubsection
EndSection
The preset commands or parameters could be adjusted to achieve the different
requirements under different situations when users or administrators submit their
operations. The standard and error outputs will be shown to you when completely executing
the operation scripts.
Define Operation
Users or administrators also can define their own operations on the fly if there is no preset operation achieving their requirements. Selecting the "Define Operation" option displays the Operation Configuration Panel, as shown in Figure 21.
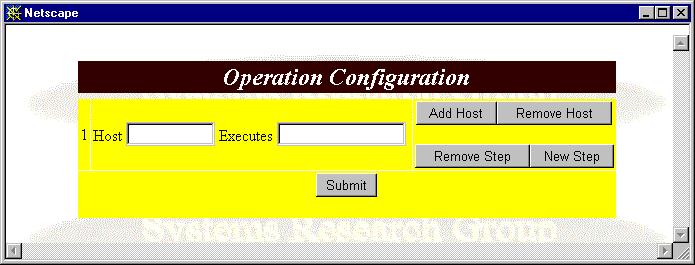
Figure 21: Operation Configuration Panel
Follow these steps to set the host(s), execution script(s), and the executing order(s):
Step 1. Type one host name and the execution script.
Step 2. If another host executes operation at the same
time, click "Add Host" button and go to Step 3.
If there is no such host but some hosts will execute operations after the operation of the
host in Step 1, click "New Step" button and go to Step 4.
If there is no other host involved, click "Submit" button to submit your
operation.
Step 3. The panel is shown as figure 22. Type host name and execution script into the new forms as Step 1, then go back Step 2.
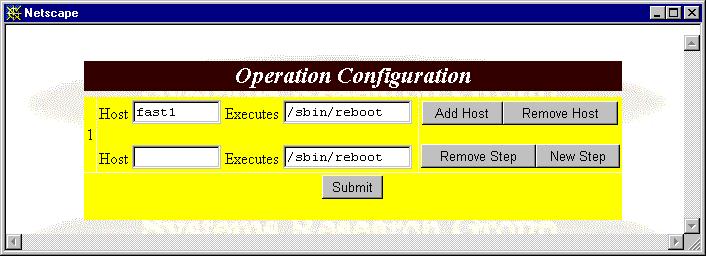
Figure 22: The Panel After Clicking "Add Host" Button
Step 4. The panel is shown as figure 23. Type the host name and execution script into the new step forms as Step 1, then go back Step 2.
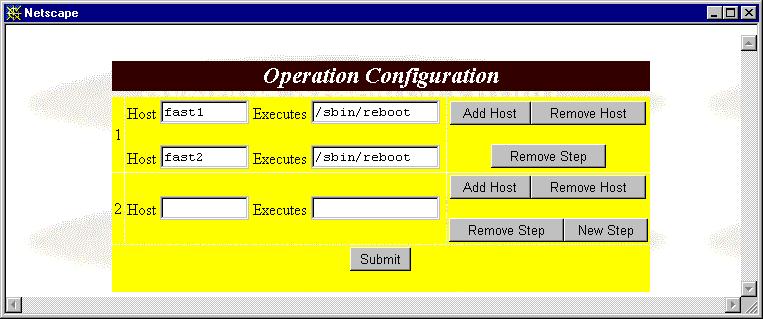
Figure 23: The Panel After Clicking "New Step" Button